The United States Census Bureau produces a wide variety of infographics and visualizations based on their enormous library of demographic data. Many of these charts and graphs address topics relevant to family law practitioners. Household characteristics, marital status, child support payments, and parental or marital age are just a few of the datasets depicted on the Census Bureau’s website (https://www.census.gov/library/visualizations.All.html). Below is a sample of these visualizations, along with a brief description of the insights that might be obtained.
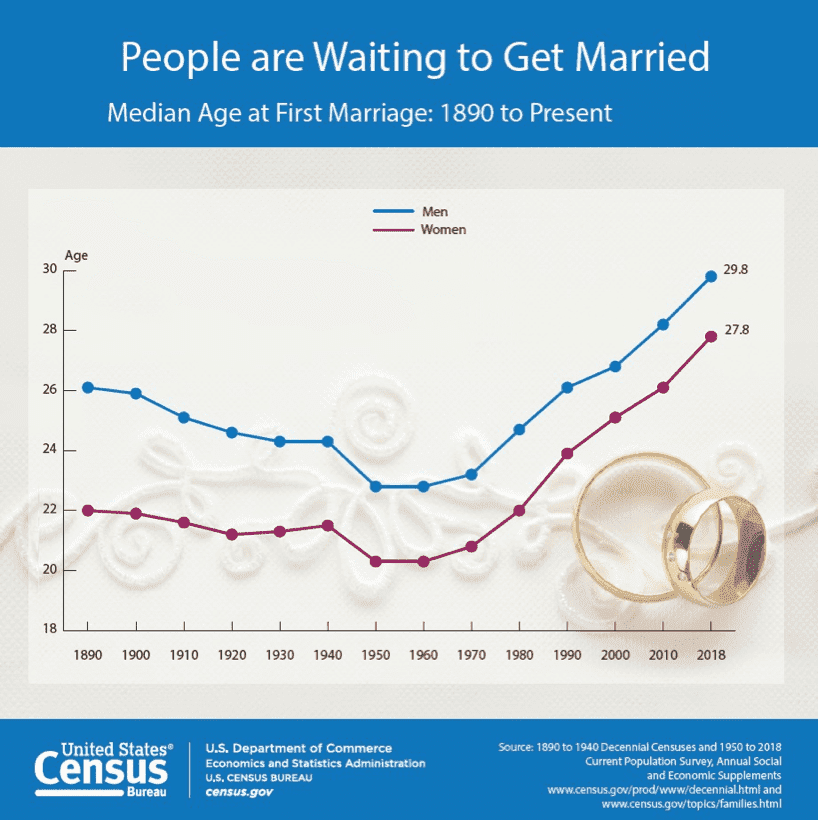
This first graph depicts the median age of men and women at their first marriage, over time. Median means that 50% of the men (or women) sampled that year got married for the first time by the listed age. So, in 1890, 50% of women were married by age 22 while 50% of men were married by age 26. By contrast, in 2018 the median ages at first marriage had increased to roughly 30 and 28 years old for men and women, respectively. Two interesting pieces of insight drawn from this graph are that the age of first marriage has been increasing steadily since 1960 for men and women, and that women consistently marry at a younger age than men. For the family law practitioner, this means that the age at first divorce is also likely increasing and that female clients are likely to be younger than their male counterparts.
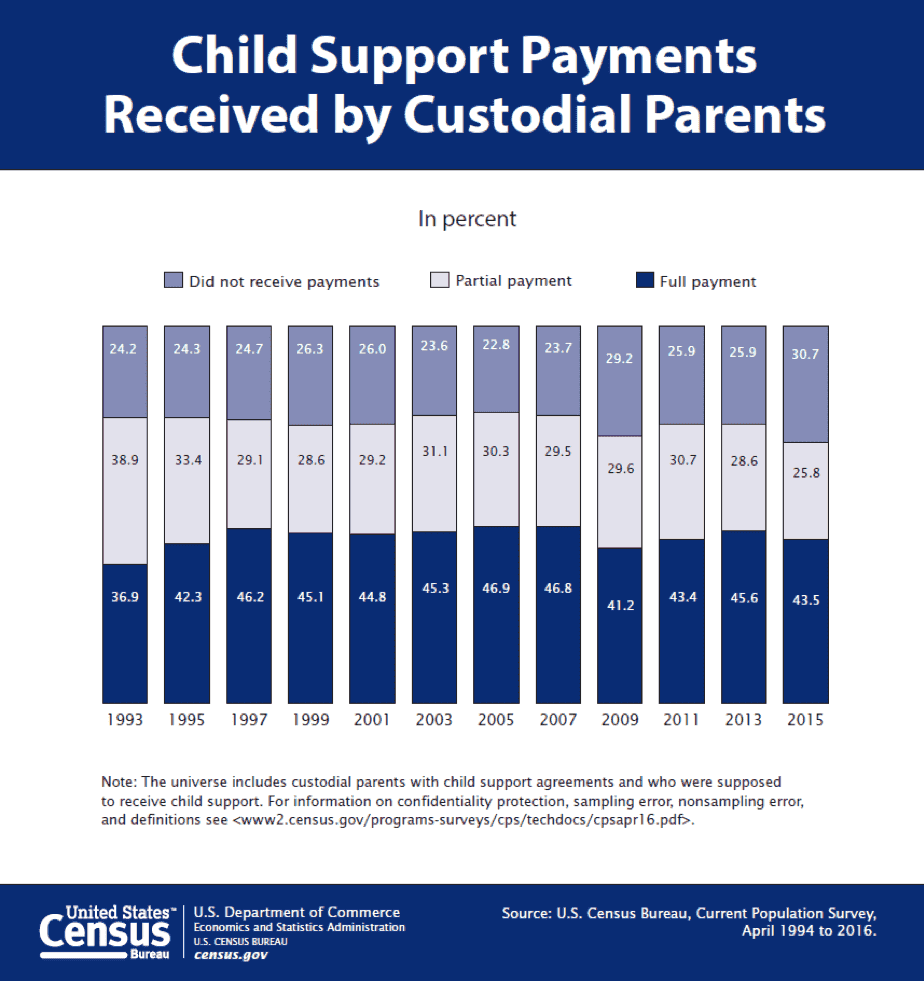
The next chart displays the proportion of custodial parents that received child support payments, over time. For example, in 1993, less than 37% of custodial parents received their full support payment. Ten years later, in 2003, over 45% of custodial parents received their full support payment. An interesting piece of information derived from this data is that the proportion of custodial parents receiving their full support payment has never exceeded 50% (since 1993). However, roughly 75% of custodial parents are receiving at least partial payment. For the family law practitioner, it is important to note that many custodial parent clients (25-30%) may not receive their ordered child support.
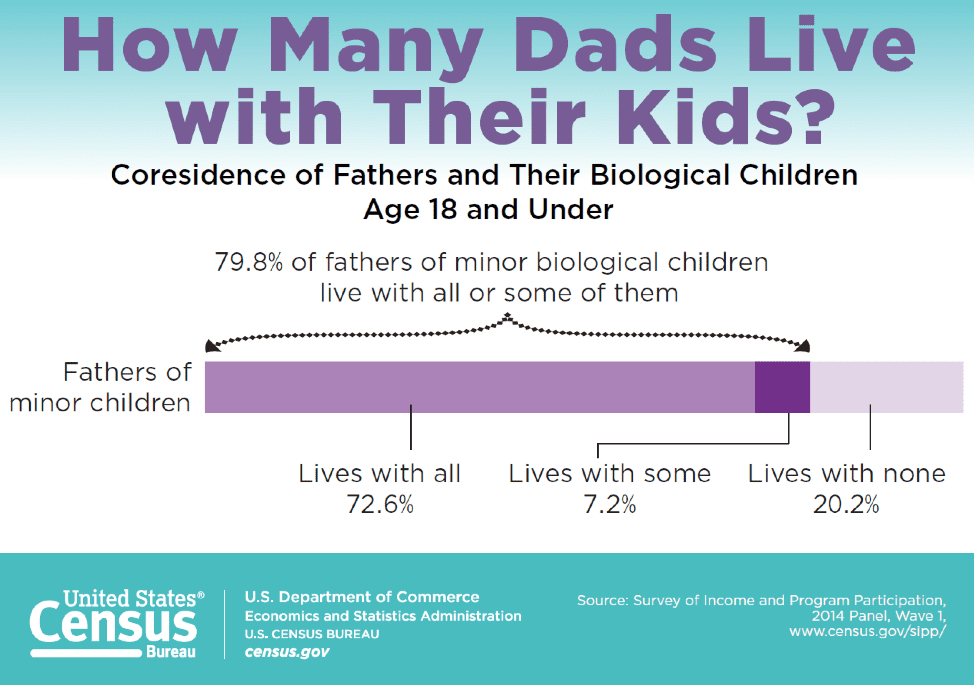
The next visual regards the co-residence of fathers and their biological children in 2014. Nearly 80% of men with biological children lived with at least some of them. Of course, that also means that 20% of fathers were not living with any of their children. This living arrangement could be by choice or court order, but the graphic does not indicate that information. For family law practitioners, this data may help establish expectations for parenting time among male clients.
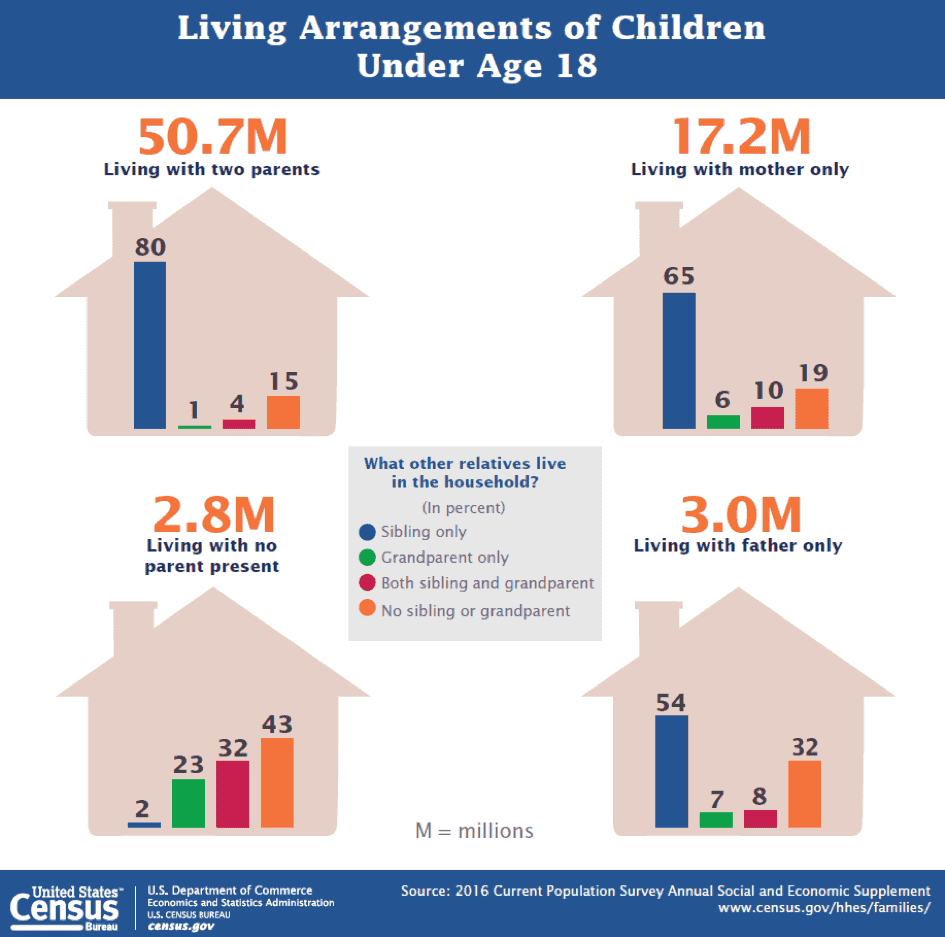
The next graphic addresses the living arrangements of minor children. Nearly 74 million children were included in this sample from 2016. Of those children, more than two-thirds were living with both parents. At the same time, 23% were living with only their mother and 4% were living with only their father. For the 2.8 million children with no parent in the household, 55% were living with a grandparent.